Стек и куча - основные структуры памяти. Посмотрим на утечки в куче, как располагаются данные в стеке и всё такое
Как растёт стек
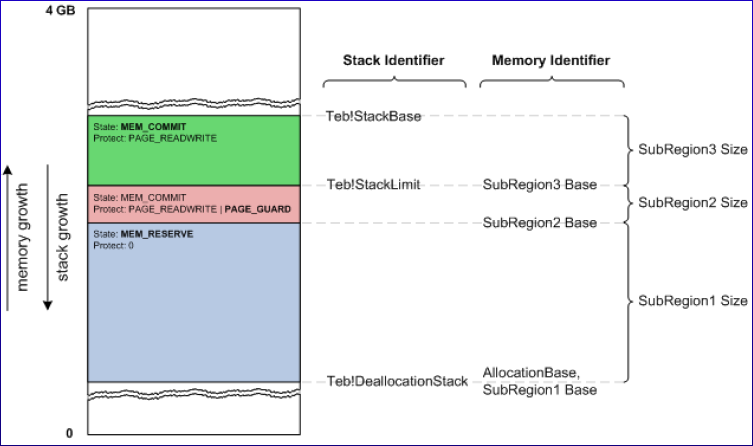
Структура стека:
- The ESP egister points to the current stack location of a thread
- If a program attempts to access an address within a guard page, the system raises a STATUS_GUARD_PAGE_VIOLATION (0x80000001) exception. A guard page provides a one-shot alarm for memory page access
- If a stack grows until the end of reserved memory, a STATUS_STACK_OVERFLOW is raised
Заполним стек
kd> !teb
...
StackBase:            0000000000700000
StackLimit:           00000000006fc000
...

kd> dt nt!_TEB -y DeallocationStack 000000000033f000
+0x1478 DeallocationStack : 0x00000000`00500000 Void

kd> ?0000000000700000 - 00000000006fc000
Evaluate expression: 16384 = 00000000`00004000

//TODO прописать заполнение адреса
А что там с кучей то?
If page heap is disabled (а он по дефолту выключен), apply the following structs:
- _HEAP struct
-
- defined в ntdll.dll: dt nt!_HEAP
-
- for every HeapCreate there is a unique _HEAP
-
- !heap -p -all to get addresses for all _HEAP structs in process
- _HEAP_ENTRY struct
-
- defined in ntdll: dt nt!_HEAP_ENTRY
-
- for every HeapAlloc there is a unique _HEAP_ENTRY
-
- !heap -p -all to get addresses for all heap entries in process
If page heap is enabled, apply the following structs:
- _DPH_HEAP_ROOT struct
-
- defined в ntdll.dll: dt nt!_DPH_HEAP_ROOT
-
- for every HeapCreate there is a unique _DPH_HEAP_ROOT
-
- !heap -p -all to get addresses for all heap roots in process
-
- Usually address of a _DPH_HEAP_ROOT = value of HeapHandle + 0x1000
- _DPH_HEAP_BLOCK struct
-
- defined in ntdll: dt nt!_DPH_HEAP_BLOCK
-
- for every HeapAlloc there is a unique _DPH_HEAP_BLOCK
-
- !heap -p -all to get addresses for all heap blocks in process
Кто вызвал HeapAlloc?
Включаем stack traces и page heap для процесса:
- Либо в gui gflags.exe тыкаем Create user mode stack trace database и Enable page heap
- Либо gflags.exe /i +ust +hpa
Меняем контекст процесса:
kd> .process /i ffffe78c24835240
You need to continue execution (press 'g' <enter>) for the context
to be switched. When the debugger breaks in again, you will be in
the new process context.

kd> g
Break instruction exception - code 80000003 (first chance)
nt!DbgBreakPointWithStatus:
fffff803`7d9ff050 cc              int     3


Идем до места, где вызываем HeapAlloc и получаем адрес возврата, который является DPH_HEAP_BLOCK

kd> !heap -p -a 282bff41000
    address 00000282bff41000 found in
    _DPH_HEAP_ROOT @ 282bfd11000
    in busy allocation (  DPH_HEAP_BLOCK:         UserAddr         UserSize -         VirtAddr         VirtSize)
                             282bfd17478:      282bff41000             2000 -      282bff40000             4000
ReadMemory error for address 00000282bff41000
    00007ff97ca6867b ntdll!RtlDebugAllocateHeap+0x000000000000003b
    00007ff97c99d255 ntdll!RtlpAllocateHeap+0x00000000000000f5
    00007ff97c99b44d ntdll!RtlpAllocateHeapInternal+0x0000000000000a2d
    00007ff72cfa107a +0x00007ff72cfa107a
    00007ff72cfa12e0 +0x00007ff72cfa12e0
    00007ff97bcd7034 +0x00007ff97bcd7034
    00007ff97c9c2651 ntdll!RtlUserThreadStart+0x0000000000000021


kd> dt ntdll!_DPH_HEAP_BLOCK StackTrace 282bfd17478
   +0x060 StackTrace : 0x00000282`be539400 _RTL_TRACE_BLOCK


посмотрим на stack trace

kd> dq /c1 0x00000282`be539400 L10
00000282`be539400  00000000`00000000
00000282`be539408  00070000`00003801        0033:00007ff9`7ca68675  call    qword ptr [ntdll!_guard_dispatch_icall_fptr (00007ff9`7caf3000)]
00000282`be539410  00007ff9`7ca6867b ---->  0033:00007ff9`7ca6867b  mov     rbx,qword ptr [rsp+70h]

                                            0033:00007ff9`7c99d250  call    ntdll!RtlDebugAllocateHeap (00007ff9`7ca68640)
00000282`be539418  00007ff9`7c99d255 ---->  0033:00007ff9`7c99d255  jmp     ntdll!RtlpAllocateHeap+0xc6 (00007ff9`7c99d226)

                                            0033:00007ff9`7c99b448  call    ntdll!RtlpAllocateHeap (00007ff9`7c99d160)
00000282`be539420  00007ff9`7c99b44d ---->  0033:00007ff9`7c99b44d  mov     rdi,rax


непосредственный вызов функи HeapAlloc из моего кода
                                            0033:00007ff7`2cfa1074  call    qword ptr [00007ff7`2cfa2008] (HeapAlloc)
00000282`be539428  00007ff7`2cfa107a ---->  0033:00007ff7`2cfa107a  call    qword ptr [00007ff7`2cfa2010] ds:002b:00007ff7`2cfa2010=00007ff97bcd5bb0 (GetProcessHeap)

                                            0033:00007ff7`2cfa12db  call    00007ff7`2cfa1000 (main из crt start)
00000282`be539430  00007ff7`2cfa12e0 ---->  0033:00007ff7`2cfa12e0  mov     ebx,eax
00000282`be539438  00007ff9`7bcd7034

                                             ntdll!RtlUserThreadStart:
                                             0033:00007ff9`7c9c2630  sub     rsp,78h
                                             0033:00007ff9`7c9c2634  mov     r9,rcx
                                             0033:00007ff9`7c9c2637  mov     rax,qword ptr [ntdll!Kernel32ThreadInitThunkFunction (00007ff9`7cad9ff0)]
                                             0033:00007ff9`7c9c263e  test    rax,rax
                                             0033:00007ff9`7c9c2641  je      ntdll!RtlUserThreadStart+0x23 (00007ff9`7c9c2653)
                                             0033:00007ff9`7c9c2643  mov     r8,rdx
                                             0033:00007ff9`7c9c2646  mov     rdx,rcx
                                             0033:00007ff9`7c9c2649  xor     ecx,ecx
                                             0033:00007ff9`7c9c264b  call    qword ptr [ntdll!_guard_dispatch_icall_fptr (00007ff9`7caf3000)]
00000282`be539440  00007ff9`7c9c2651 ----->  0033:00007ff9`7c9c2651  jmp     ntdll!RtlUserThreadStart+0x43 (00007ff9`7c9c2673)
00000282`be539448  00000000`00000000
00000282`be539450  00000000`00000000
00000282`be539458  00000000`00000000
00000282`be539460  00000000`00000000
00000282`be539468  00000000`00000000
00000282`be539470  00000000`00000000
00000282`be539478  00000000`00000000
Ищем утечки памяти на хипе
Summary about memory usage for your process. If RegionUsageHeap or RegionUsagePageHeap is growing constantly, then you might have a memory leak on the heap. Proceed with the following steps.
!address --summary
Сделаем фиктивную утечку памяти и посмотрим на неё, можно что-то в этом духе:
#include <Windows.h>
#include <iostream>

int main(int argc, char *argv[]) {

	PVOID Heap = NULL;
	std::cout << "Allocate: ";
	int size;
	std::cin >> size;
	int *array = new int[size];
	std::cout << "Allocated!\n";

	Sleep(3000);

	return 0;
}
До аллокации

kd> !heap -stat -h 0
Allocations statistics for
heap @ 0000021a6eb40000
group-by: TOTSIZE max-display: 20
    size     #blocks     total     ( %) (percent of total busy bytes)
    1000 3 - 3000  (27.66)
    1200 1 - 1200  (10.37)
    c38 1 - c38  (7.04)
    120 9 - a20  (5.83)
    400 2 - 800  (4.61)
    200 4 - 800  (4.61)
    100 8 - 800  (4.61)
    790 1 - 790  (4.36)
    6de 1 - 6de  (3.96)
    1d8 3 - 588  (3.19)
    470 1 - 470  (2.56)
    228 2 - 450  (2.48)
    390 1 - 390  (2.05)
    50 b - 370  (1.98)
    348 1 - 348  (1.89)
    238 1 - 238  (1.28)
    10 1d - 1d0  (1.04)
    20 c - 180  (0.86)
    168 1 - 168  (0.81)
    158 1 - 158  (0.77)
Allocations statistics for
 heap @ 0000021a6e8e0000
group-by: TOTSIZE max-display: 20
    size     #blocks     total     ( %) (percent of total busy bytes)


После аллокации

kd> !heap -stat -h 0
Allocations statistics for
heap @ 0000021a6eb40000
group-by: TOTSIZE max-display: 20
    size     #blocks     total     ( %) (percent of total busy bytes)
    2625a00 1 - 2625a00  (99.89)
    1000 3 - 3000  (0.03)
    1200 1 - 1200  (0.01)
    c38 1 - c38  (0.01)
    120 9 - a20  (0.01)
    400 2 - 800  (0.01)
    200 4 - 800  (0.01)
    100 8 - 800  (0.01)
    790 1 - 790  (0.00)
    6de 1 - 6de  (0.00)
    1d8 3 - 588  (0.00)
    470 1 - 470  (0.00)
    228 2 - 450  (0.00)
    390 1 - 390  (0.00)
    50 b - 370  (0.00)
    348 1 - 348  (0.00)
    238 1 - 238  (0.00)
    10 20 - 200  (0.00)
    20 c - 180  (0.00)
    168 1 - 168  (0.00)
Allocations statistics for
 heap @ 0000021a6e8e0000
group-by: TOTSIZE max-display: 20
    size     #blocks     total     ( %) (percent of total busy bytes)


Найдём все аллокации с нашим размером 2625a00
kd> !heap -flt s 2625a00
    _DPH_HEAP_ROOT @ 297e9ed1000
    Freed and decommitted blocks
      DPH_HEAP_BLOCK : VirtAddr VirtSize
    Busy allocations
      DPH_HEAP_BLOCK : UserAddr  UserSize - VirtAddr VirtSize
        00000297e9edb068 : 00000297ec170600 0000000002625a00 - 00000297ec170000 0000000002627000
    _HEAP @ 297eaf60000
    _DPH_HEAP_ROOT @ 297eb061000
    Freed and decommitted blocks
      DPH_HEAP_BLOCK : VirtAddr VirtSize
    Busy allocations
      DPH_HEAP_BLOCK : UserAddr  UserSize - VirtAddr VirtSize
    _HEAP @ 297ec160000


kd> !heap -p -a 00000297ec170600
    address 00000297ec170600 found in
    _DPH_HEAP_ROOT @ 297e9ed1000
    in busy allocation (  DPH_HEAP_BLOCK:         UserAddr         UserSize -         VirtAddr         VirtSize)
                             297e9edb068:      297ec170600          2625a00 -      297ec170000          2627000
    00007ff97ca6867b ntdll!RtlDebugAllocateHeap+0x000000000000003b
    00007ff97c99d255 ntdll!RtlpAllocateHeap+0x00000000000000f5
    00007ff97c99b44d ntdll!RtlpAllocateHeapInternal+0x0000000000000a2d
    00007ff97a8cfde6 ucrtbase!_malloc_base+0x0000000000000036
    00007ff724531717 threads+0x0000000000001717
    00007ff724531058 threads+0x0000000000001058
    00007ff7245314f8 threads+0x00000000000014f8
    00007ff97bcd7034 KERNEL32!BaseThreadInitThunk+0x0000000000000014
    00007ff97c9c2651 ntdll!RtlUserThreadStart+0x0000000000000021
Critical Sections
kd> !cs
...
-----------------------------------------
DebugInfo          = 0x00000297e9f95fd0
Critical section   = 0x00007ff97a52d000 (KERNELBASE!ConsoleStateLock+0x0)
NOT LOCKED
LockSemaphore      = 0x0
SpinCount          = 0x0000000000000000
-----------------------------------------
...


kd> !cs -s -o 0x00007ff97a52d000
-----------------------------------------
Critical section   = 0x00007ff97a52d000 (KERNELBASE!ConsoleStateLock+0x0)
DebugInfo          = 0x00000297e9f95fd0
NOT LOCKED
LockSemaphore      = 0x0
SpinCount          = 0x0000000000000000


Stack trace for DebugInfo = 0x00000297e9f95fd0:

0x00007ff97a2b0cee: KERNELBASE!_KernelBaseBaseDllInitialize+0x44E
0x00007ff97a2b071d: KERNELBASE!KernelBaseDllInitialize+0xD
0x00007ff97c989a1d: ntdll!LdrpCallInitRoutine+0x61
0x00007ff97c9dc1e7: ntdll!LdrpInitializeNode+0x1D3
0x00007ff97c9dbf7a: ntdll!LdrpInitializeGraphRecurse+0x42
0x00007ff97c9dc000: ntdll!LdrpInitializeGraphRecurse+0xC8
0x00007ff97c9ad937: ntdll!LdrpPrepareModuleForExecution+0xBF
0x00007ff97c98fbae: ntdll!LdrpLoadDllInternal+0x19A
0x00007ff97c9873e4: ntdll!LdrpLoadDll+0xA8
0x00007ff97c986af4: ntdll!LdrLoadDll+0xE4
0x00007ff97ca4372f: ntdll!LdrpInitializeProcess+0x1ACF
0x00007ff97c9e4cdb: ntdll!LdrpInitialize+0x15F
0x00007ff97c9e4b63: ntdll!LdrpInitialize+0x3B
0x00007ff97c9e4b0e: ntdll!LdrInitializeThunk+0xE
напочитать:
Классная преза, с кучей полезного по windbg